1934 Nevada gubernatorial election
Election for the Governor of Nevada
 | |||||||||||||||||||||
| |||||||||||||||||||||
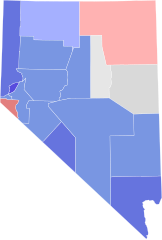 County results Kirman: 40–50% 50–60% 60–70% 70–80% Griswold: 40–50% 50–60% Branson: 30–40% 40–50% | |||||||||||||||||||||
| |||||||||||||||||||||

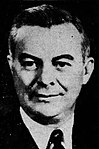


The 1934 Nevada gubernatorial election was held on November 6, 1934. Democratic nominee Richard Kirman Sr. defeated incumbent Republican Morley Griswold with 53.94% of the vote.
Primary elections
Primary elections were held on September 4, 1934.[1]
Democratic primary
Candidates
- Richard Kirman Sr., former Mayor of Reno
- Harley A. Harmon, Chairman of the Nevada Public Service Commission
- John A. Cooper
- Archie C. Grant
- Maurice J. Sullivan, former Lieutenant Governor
- Charles L. Richards, former U.S. Representative
Results
| Party | Candidate | Votes | % | |
|---|---|---|---|---|
| Democratic | Richard Kirman Sr. | 6,058 | 32.44 | |
| Democratic | Harley A. Harmon | 5,574 | 29.85 | |
| Democratic | John A. Cooper | 2,028 | 10.86 | |
| Democratic | Archie C. Grant | 1,849 | 9.90 | |
| Democratic | Maurice J. Sullivan | 1,632 | 8.74 | |
| Democratic | Charles L. Richards | 1,531 | 8.20 | |
| Total votes | 18,672 | 100.00 | ||
General election
Candidates
Major party candidates
- Richard Kirman Sr., Democratic
- Morley Griswold, Republican
Other candidates
- Lindley C. Branson, Independent
Results
| Party | Candidate | Votes | % | ±% | |
|---|---|---|---|---|---|
| Democratic | Richard Kirman Sr. | 23,088 | 53.94% | +7.18% | |
| Republican | Morley Griswold (incumbent) | 14,778 | 34.52% | −18.73% | |
| Independent | Lindley C. Branson | 4,940 | 11.54% | +11.54% | |
| Majority | 8,310 | 19.41% | |||
| Total votes | 42,806 | 100.00% | |||
| Democratic gain from Republican | Swing | +25.91% | |||
Results by county
| County | Richard Kirman Sr. Democratic | Morley Griswold Republican | Lindley C. Branson Independent | Margin | Total votes cast[2] | ||||
|---|---|---|---|---|---|---|---|---|---|
| # | % | # | % | # | % | # | % | ||
| Churchill | 1,347 | 57.79% | 644 | 27.63% | 340 | 14.59% | 703 | 30.16% | 2,331 |
| Clark | 3,829 | 61.27% | 1,875 | 30.00% | 545 | 8.72% | 1,954 | 31.27% | 6,249 |
| Douglas | 394 | 49.07% | 397 | 49.44% | 12 | 1.49% | -3 | -0.37% | 803 |
| Elko | 1,733 | 43.46% | 1,846 | 46.29% | 409 | 10.26% | -113 | 2.83% | 3,988 |
| Esmeralda | 453 | 68.95% | 156 | 23.74% | 48 | 7.31% | 297 | 45.21% | 657 |
| Eureka | 213 | 35.15% | 179 | 29.54% | 214 | 35.31% | -1 | -0.17% | 606 |
| Humboldt | 815 | 49.73% | 592 | 36.12% | 232 | 14.15% | 223 | 13.61% | 1,639 |
| Lander | 476 | 57.35% | 274 | 33.01% | 80 | 9.64% | 202 | 24.34% | 830 |
| Lincoln | 960 | 53.93% | 612 | 34.38% | 208 | 11.69% | 348 | 19.55% | 1,780 |
| Lyon | 1,003 | 56.96% | 708 | 40.20% | 50 | 2.84% | 295 | 16.75% | 1,761 |
| Mineral | 598 | 57.06% | 384 | 36.64% | 66 | 6.30% | 214 | 20.42% | 1,048 |
| Nye | 1,045 | 54.51% | 572 | 29.84% | 300 | 15.65% | 473 | 24.67% | 1,917 |
| Ormsby | 680 | 55.37% | 531 | 43.24% | 17 | 1.38% | 149 | 12.13% | 1,228 |
| Pershing | 596 | 52.65% | 340 | 30.04% | 196 | 17.31% | 256 | 22.61% | 1,132 |
| Storey | 393 | 71.85% | 138 | 25.23% | 16 | 2.93% | 255 | 46.62% | 547 |
| Washoe | 7,729 | 60.32% | 4,402 | 34.35% | 683 | 5.33% | 3,327 | 25.96% | 12,814 |
| White Pine | 824 | 23.71% | 1,128 | 32.45% | 1,524 | 43.84% | -396[a] | -11.39% | 3,476 |
| Totals | 23,088 | 53.94% | 14,778 | 34.52% | 4,940 | 11.54% | 8,310 | 19.41% | 42,806 |
Counties that flipped from Republican to Democratic
Counties that flipped from Republican to Independent
Counties that flipped from Democratic to Independent
Notes
- ^ Margin over Griswold
References
- ^ a b Guide to U.S. elections - CQ Press, Congressional Quarterly, inc. CQ Press. 2005. ISBN 9781568029818. Retrieved April 1, 2020.
- ^ a b Nevada Secretary of State. Official Returns of the General Election of 1934. Carson City, Nevada: State Printing Office. p. 40.


