2024 Colchester City Council election
Colchester City Council election
 | |||||||||||||||||||||||||||||||||||||||||||||||||||||||||||||||||||||||||||||
18 out of 51 seats to Colchester City Council 26 seats needed for a majority | |||||||||||||||||||||||||||||||||||||||||||||||||||||||||||||||||||||||||||||
|---|---|---|---|---|---|---|---|---|---|---|---|---|---|---|---|---|---|---|---|---|---|---|---|---|---|---|---|---|---|---|---|---|---|---|---|---|---|---|---|---|---|---|---|---|---|---|---|---|---|---|---|---|---|---|---|---|---|---|---|---|---|---|---|---|---|---|---|---|---|---|---|---|---|---|---|---|---|
| Turnout | 29.9% ( 1.1%) 1.1%) | ||||||||||||||||||||||||||||||||||||||||||||||||||||||||||||||||||||||||||||
| |||||||||||||||||||||||||||||||||||||||||||||||||||||||||||||||||||||||||||||
 Winner of each seat at the 2024 Colchester City Council election | |||||||||||||||||||||||||||||||||||||||||||||||||||||||||||||||||||||||||||||
| |||||||||||||||||||||||||||||||||||||||||||||||||||||||||||||||||||||||||||||

The 2024 Colchester City Council election took place on 2 May 2024 alongside other local elections across England.[1] Eighteen members of the council were elected, one from each of the wards, with an additional by-election in Greenstead ward.[2][3]
The council was under no overall control prior to the election. The Conservatives were the largest party, but the council was being run by a Liberal Democrat minority administration with informal support from Labour and the Green Party. Only two seats changed party at the election, and after the election the Liberal Democrats continued to form a minority administration, with Labour and the Greens lending their support on a case-by-case basis.[4]
Background
This set of seats were last up for election at the 2021 election. Due to the COVID-19 pandemic, the City Council election (then Borough) scheduled for 2020 was postponed one year to 2021. This resulted in the terms of councillors elected at the 2021 election being truncated to 3-years rather than the usual 4-years.
In addition to the seventeen regular members up for election, there will be a by-election in Greenstead ward due to the resignation of Cllr Molly Bloomfield.
19 16 14 2 | ||
|---|---|---|
| Party | Seats | |
| Conservative Party | 19 | |
| Liberal Democrats | 16 | |
| Labour Party | 14 | |
| Green Party | 2 | |
Summary
Overview
At the election, Labour made a significant advance in vote share, coming first in the popular vote (for the first time since the inaugural 1973 election) and winning the marginal ward of Shrub End from the Liberal Democrats, and making large gains in vote share across the city. In contrast, the Liberal Democrats lost a large portion of their vote when compared to the 2023 election, failing to win their top targets of Stanway and Prettygate; they did, however, retain the marginal seat of Highwoods against Labour.
For the Conservativates, it was another disappointing result, losing the popular vote to Labour and seeing their vote share decline or stagnate in key wards such as Castle and Highwoods. They did, however, retain their seat in Stanway against a strong challenge from the Liberal Democrats. The Green Party remained static in the popular vote, but managed to unseat their former leader (who defected to Labour in 2022) in Castle ward, bringing their total number of seats to 3.
Candidates by party
Conservative Party (18/18)
Labour Party (18/18)
Green Party (18/18)
Liberal Democrats (17/18)
Independent (3/18)
Reform UK (2/18)
Election result
| 2024 Colchester City Council election | ||||||||||
|---|---|---|---|---|---|---|---|---|---|---|
| Party | This election | Full council | This election | |||||||
| Seats | Net | Seats % | Other | Total | Total % | Votes | Votes % | +/− | ||
| Conservative | 7 |  | 38.9 | 12 | 19 | 37.3 | 13,080 | 30.0 | –0.5 | |
| Liberal Democrats | 4 | 1 | 22.2 | 11 | 15 | 29.4 | 9,972 | 22.9 | –7.4 | |
| Labour | 6 | | 33.3 | 8 | 14 | 27.5 | 14,180 | 32.5 | +8.0 | |
| Green | 1 |  1 1 | 5.6 | 2 | 3 | 5.9 | 4,447 | 10.2 | ±0.0 | |
| Independent | 0 | | 0.0 | 0 | 0 | 0.0 | 1,158 | 2.7 | –0.5 | |
| Reform UK | 0 | | 0.0 | 0 | 0 | 0.0 | 766 | 1.8 | +0.5 | |
Incumbents
| Ward | Incumbent Councillor | Party | Re-standing | |
|---|---|---|---|---|
| Berechurch | Dave Harris | Labour Co-op | Yes | |
| Castle | Steph Nissen[a] | Labour | Yes | |
| Greenstead | Julie Young | Labour Co-op | Yes | |
| Highwoods | Simon Appleton[b] | Liberal Democrats | Yes | |
| Lexden & Braiswick | Dennis Willetts | Conservative | Yes | |
| Marks Tey & Layer | Kevin Bentley | Conservative | Yes | |
| Mersea & Pyefleet | John Jowers | Conservative | No | |
| Mile End | Martin Goss | Liberal Democrats | Yes | |
| New Town & Christ Church | Pam Cox | Labour | Yes | |
| Old Heath & The Hythe | Mike Lilley | Labour Co-op | Yes | |
| Prettygate | Sue Lissimore | Conservative | Yes | |
| Rural North | Darius Laws | Conservative | Yes | |
| Shrub End | Lyn Barton | Liberal Democrats | No | |
| St. Anne's & St. John's | Mike Hogg | Liberal Democrats | No | |
| Stanway | Jeremy Hagon | Conservative | Yes | |
| Tiptree | Roger Mannion | Conservative | Yes | |
| Wivenhoe | Michelle Burrows | Liberal Democrats | No | |
Ward results
The Statement of Persons Nominated details the candidates standing in each ward. It was released on 5 April 2023 following the close of nominations.[5] Incumbents are marked with an asterisk (*).
Berechurch

| Party | Candidate | Votes | % | ±% | |
|---|---|---|---|---|---|
| Labour Co-op | Dave Harris* | 1,536 | 79.5 | +13.4 | |
| Conservative | Bevan Waghorn | 207 | 10.7 | –4.9 | |
| Liberal Democrats | Karen Chaplin | 96 | 5.0 | –4.2 | |
| Green | John Clifton | 94 | 4.9 | –0.4 | |
| Majority | 1,329 | 68.8 | +18.3 | ||
| Turnout | 1,933 | 26.5 | +1.1 | ||
| Registered electors | 7,309 | ||||
| Labour Co-op hold | Swing | 9.2 | |||
Castle

| Party | Candidate | Votes | % | ±% | |
|---|---|---|---|---|---|
| Green | Kemal Çufoğlu | 1,247 | 44.5 | –5.9 | |
| Labour | Steph Nissen* | 826 | 29.4 | +11.4 | |
| Conservative | Ryan Smith | 523 | 18.6 | –5.4 | |
| Liberal Democrats | Martin Gillingham | 209 | 7.5 | –0.1 | |
| Majority | 421 | 15.1 | –11.3 | ||
| Turnout | 2,805 | 33.7 | +0.3 | ||
| Registered electors | 8,329 | ||||
| Green gain from Labour | Swing | 8.7 | |||
Greenstead
| Party | Candidate | Votes | % | ±% | |
|---|---|---|---|---|---|
| Labour Co-op | Julie Young* | 1,159 | 63.5 | +4.2 | |
| Labour | Elizabeth Alake-Akinyemi | 1,150 | 63.0 | +3.7 | |
| Conservative | Rowan Knight | 358 | 19.6 | +0.9 | |
| Conservative | Ronnie Achille | 335 | 18.4 | –0.3 | |
| Green | Lisa Cross | 258 | 14.1 | +7.6 | |
| Liberal Democrats | Jenny Stevens | 225 | 12.3 | +1.8 | |
| Green | Zac Roulston | 165 | 9.0 | +2.5 | |
| Turnout | 1,825 | 17.6 | +0.6 | ||
| Registered electors | 10,350 | ||||
| Labour Co-op hold | |||||
| Labour hold | |||||
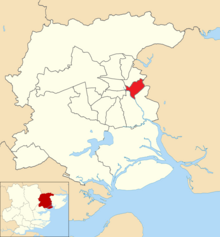
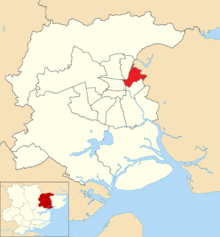
Highwoods

| Party | Candidate | Votes | % | ±% | |
|---|---|---|---|---|---|
| Liberal Democrats | Simon Appleton* | 947 | 45.0 | –1.5 | |
| Labour | Gary Braddy | 717 | 34.1 | +1.4 | |
| Conservative | Christopher Hayter | 345 | 16.4 | –0.6 | |
| Green | Antony Greenwood | 96 | 4.6 | +0.8 | |
| Majority | 230 | 10.9 | –2.9 | ||
| Turnout | 2,105 | 28.7 | –1.5 | ||
| Registered electors | 7,325 | ||||
| Liberal Democrats hold | Swing | 1.5 | |||
Lexden & Braiswick

| Party | Candidate | Votes | % | ±% | |
|---|---|---|---|---|---|
| Conservative | Dennis Willetts | 1,420 | 55.6 | –2.5 | |
| Labour | Sandy Armitage | 556 | 21.8 | +7.7 | |
| Liberal Democrats | Thomas Stevenson | 331 | 13.0 | –5.2 | |
| Green | Roger Bamforth | 248 | 9.7 | +0.1 | |
| Majority | 864 | 33.8 | –6.1 | ||
| Turnout | 2,555 | 34.4 | –2.4 | ||
| Registered electors | 7,428 | ||||
| Conservative hold | Swing | 5.1 | |||
Marks Tey & Layer

| Party | Candidate | Votes | % | ±% | |
|---|---|---|---|---|---|
| Conservative | Kevin Bentley* | 1,176 | 53.2 | –1.6 | |
| Labour | John Spademan | 573 | 25.9 | +4.3 | |
| Green | Amy Sheridan | 246 | 11.1 | –0.7 | |
| Liberal Democrats | Mark Hull | 214 | 9.7 | –2.2 | |
| Majority | 603 | 27.3 | –5.9 | ||
| Turnout | 2,209 | 26.6 | –2.7 | ||
| Registered electors | 8,297 | ||||
| Conservative hold | Swing | 3.0 | |||
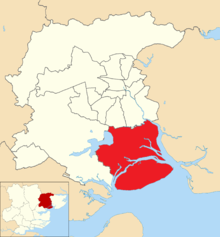
Mersea & Pyefleet
| Party | Candidate | Votes | % | ±% | |
|---|---|---|---|---|---|
| Conservative | Martin Parsons | 1,081 | 36.5 | –3.6 | |
| Independent | John Akker | 928 | 31.2 | –0.8 | |
| Reform UK | Sophie Preston-Hall | 355 | 12.0 | +5.8 | |
| Labour | Natalie Eldred | 336 | 11.3 | +1.4 | |
| Green | Libby Kirkby-Taylor | 124 | 4.8 | –0.5 | |
| Liberal Democrats | John Knight | 124 | 4.2 | –2.3 | |
| Majority | 153 | 5.3 | +2.8 | ||
| Turnout | 2,962 | 37.0 | –1.9 | ||
| Registered electors | 8,013 | ||||
| Conservative hold | Swing | 1.6 | |||
Mile End
| Party | Candidate | Votes | % | ±% | |
|---|---|---|---|---|---|
| Liberal Democrats | Martin Goss* | 1,889 | 68.2 | +7.0 | |
| Labour Co-op | Pauline Bacon | 445 | 16.1 | +2.8 | |
| Conservative | Phoebe Butcher | 307 | 11.1 | –5.3 | |
| Green | Amanda Kirke | 129 | 4.7 | –4.5 | |
| Majority | 1,444 | 52.1 | +7.3 | ||
| Turnout | 2,770 | 28.1 | +0.5 | ||
| Registered electors | 9,873 | ||||
| Liberal Democrats hold | Swing | 2.1 | |||
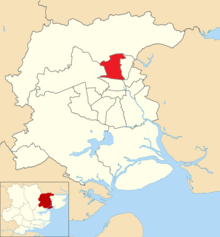
New Town & Christ Church

| Party | Candidate | Votes | % | ±% | |
|---|---|---|---|---|---|
| Labour | Pam Cox* | 1,639 | 57.3 | +15.4 | |
| Conservative | Christopher Piggott | 468 | 16.4 | +3.5 | |
| Liberal Democrats | Alan Mathias | 350 | 12.2 | –19.7 | |
| Green | Sara Ruth | 275 | 9.6 | +2.9 | |
| Independent | Ian Partridge | 128 | 4.5 | –2.2 | |
| Majority | 1,171 | 40.9 | +30.9 | ||
| Turnout | 2,860 | 29.6 | –2.6 | ||
| Registered electors | 9,675 | ||||
| Labour hold | Swing | 6.0 | |||
Old Heath & The Hythe

| Party | Candidate | Votes | % | ±% | |
|---|---|---|---|---|---|
| Labour Co-op | Mike Lilley* | 1,291 | 58.9 | –0.4 | |
| Conservative | Richard Martin | 359 | 16.4 | +0.7 | |
| Green | Andrew Canessa | 299 | 13.6 | +5.8 | |
| Liberal Democrats | Jakub Makowski | 137 | 6.3 | –3.9 | |
| Independent | Jeffrey Drew | 106 | 4.8 | –2.3 | |
| Majority | 932 | 42.5 | –1.1 | ||
| Turnout | 2,192 | 25.5 | –1.3 | ||
| Registered electors | 8,591 | ||||
| Labour Co-op hold | Swing | 0.6 | |||
Prettygate

| Party | Candidate | Votes | % | ±% | |
|---|---|---|---|---|---|
| Conservative | Sue Lissimore* | 1,642 | 50.7 | +8.7 | |
| Liberal Democrats | John Loxley | 1,036 | 32.0 | –9.3 | |
| Labour | Chris Coates | 420 | 13.0 | +1.2 | |
| Green | Natalie Edgoose | 140 | 4.3 | –0.6 | |
| Majority | 606 | 18.7 | +18.0 | ||
| Turnout | 3,238 | 41.7 | +1.8 | ||
| Registered electors | 7,765 | ||||
| Conservative hold | Swing | 9.0 | |||
Rural North

| Party | Candidate | Votes | % | ±% | |
|---|---|---|---|---|---|
| Conservative | Darius Laws* | 1,618 | 57.5 | +1.6 | |
| Labour | Barbara Nichols | 513 | 18.2 | +4.3 | |
| Liberal Democrats | Karen Maxwell | 349 | 12.4 | –4.1 | |
| Green | John Burgess | 333 | 11.8 | –1.9 | |
| Majority | 1,105 | 39.3 | –0.1 | ||
| Turnout | 2,813 | 32.7 | –1.7 | ||
| Registered electors | 8,594 | ||||
| Conservative hold | Swing | 1.4 | |||
Shrub End

| Party | Candidate | Votes | % | ±% | |
|---|---|---|---|---|---|
| Labour | Claire Osborne | 792 | 37.9 | +4.0 | |
| Liberal Democrats | Mark Arnold | 625 | 29.9 | –9.4 | |
| Conservative | Angela Linghorn-Baker | 541 | 25.9 | +4.5 | |
| Green | Bob Brannan | 131 | 6.3 | +0.8 | |
| Majority | 167 | 8.0 | N/A | ||
| Turnout | 2,089 | 25.2 | –0.8 | ||
| Registered electors | 8,288 | ||||
| Labour gain from Liberal Democrats | Swing | 6.7 | |||
St. Anne's & St. John's
| Party | Candidate | Votes | % | ±% | |
|---|---|---|---|---|---|
| Liberal Democrats | Catherine Spindler | 1,071 | 45.1 | –8.5 | |
| Conservative | Simon Crow | 674 | 28.4 | +1.8 | |
| Labour | Brian Omiyi | 476 | 20.0 | +6.5 | |
| Green | Sabestian Dwyer | 155 | 6.5 | +0.2 | |
| Majority | 397 | 16.7 | –10.3 | ||
| Turnout | 2,376 | 29.1 | –2.5 | ||
| Registered electors | 8,167 | ||||
| Liberal Democrats hold | Swing | 5.2 | |||
Stanway

| Party | Candidate | Votes | % | ±% | |
|---|---|---|---|---|---|
| Conservative | Jeremy Hagon* | 847 | 40.1 | +10.1 | |
| Liberal Democrats | Chantelle-Louise Whyborn | 809 | 38.3 | –20.7 | |
| Labour | William Hayton | 300 | 14.2 | +6.5 | |
| Green | Clare Smee | 155 | 7.3 | +4.0 | |
| Majority | 38 | 1.8 | N/A | ||
| Turnout | 2,111 | 28.9 | –4.5 | ||
| Registered electors | 7,309 | ||||
| Conservative hold | Swing | 15.4 | |||
Tiptree

| Party | Candidate | Votes | % | ±% | |
|---|---|---|---|---|---|
| Conservative | Roger Mannion* | 971 | 44.5 | –10.0 | |
| Labour Co-op | Luke Hayes | 525 | 24.1 | +6.9 | |
| Reform UK | Ashley Girling | 411 | 18.8 | +10.2 | |
| Liberal Democrats | Sue Waite | 139 | 6.4 | –4.3 | |
| Green | Clare Burgess | 135 | 6.2 | –2.9 | |
| Majority | 446 | 20.4 | –16.9 | ||
| Turnout | 2,181 | 29.0 | –3.8 | ||
| Registered electors | 7,524 | ||||
| Conservative hold | Swing | 6.5 | |||
Wivenhoe

| Party | Candidate | Votes | % | ±% | |
|---|---|---|---|---|---|
| Liberal Democrats | Sean Kelly | 1,421 | 52.1 | –21.5 | |
| Labour | Philip Long | 926 | 33.9 | +21.2 | |
| Conservative | Andrew Higginson | 208 | 7.6 | +3.3 | |
| Green | Berthold Lausen | 175 | 6.4 | –3.0 | |
| Majority | 495 | 18.2 | –42.7 | ||
| Turnout | 2,730 | 40.9 | +2.3 | ||
| Registered electors | 6,673 | ||||
| Liberal Democrats hold | Swing | 21.4 | |||
References
- ^ "Election timetables for scheduled local government elections in England". The Electoral Commission. Retrieved 28 October 2022.
- ^ "Notice of Election" (PDF). Colchester City Council. 22 March 2024. Retrieved 23 March 2024.
- ^ "Colchester City Council upcoming elections". Colchester Council. 2023-12-30. Archived from the original on 2023-12-30. Retrieved 2023-12-30.
- ^ Hensel, Natalie (16 May 2024). "Colchester Council confirms new administration and cabinet". Daily Gazette and Essex County Standard. Retrieved 4 July 2024.
- ^ "Statement of Persons Nominated" (PDF). Colchester City Council. 5 April 2024. Retrieved 5 April 2024.
Notes
- v
- t
- e
 Council elections in Essex
- See also: Wards
- Boundary changes


