San Miguel, Zamboanga del Sur
Municipality in Zamboanga del Sur, Philippines
Municipality in Zamboanga Peninsula, Philippines

Flag

Seal
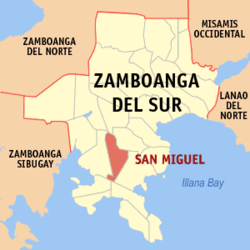
Map of Zamboanga del Sur with San Miguel highlighted
[1]
Members
- Diogracias B. Villoria
- Rene Paulo Y. Quiñones
- Sharmaine Rocel V. Loquias
- Mansueto M. Martinez
- Jerry Din
- Andro Uro
- Rosela M. Patigayon
[2]
(2020 census)[3]
31.92
7029
097324000
Cebuano
Chavacano
Tagalog
San Miguel, officially the Municipality of San Miguel (Cebuano: Lungsod sa San Miguel; Subanen: Benwa San Miguel; Chavacano: Municipalidad de San Miguel; Tagalog: Bayan ng San Miguel), is a 4th class municipality in the province of Zamboanga del Sur, Philippines. According to the 2020 census, it has a population of 19,838 people.[3]
Geography
Barangays
San Miguel is politically subdivided into 18 barangays. Each barangay consists of puroks while some have sitios.
- Betinan
- Bulawan
- Calube
- Concepcion
- Dao-an
- Dumalian
- Fatima
- Langilan
- Lantawan
- Laperian
- Libuganan
- Limonan
- Mati
- Ocapan
- Poblacion
- San Isidro
- Sayog
- Tapian
Climate
| Climate data for San Miguel, Zamboanga del Sur | |||||||||||||
|---|---|---|---|---|---|---|---|---|---|---|---|---|---|
| Month | Jan | Feb | Mar | Apr | May | Jun | Jul | Aug | Sep | Oct | Nov | Dec | Year |
| Mean daily maximum °C (°F) | 29 (84) | 30 (86) | 30 (86) | 30 (86) | 29 (84) | 28 (82) | 27 (81) | 27 (81) | 28 (82) | 28 (82) | 29 (84) | 29 (84) | 29 (84) |
| Mean daily minimum °C (°F) | 20 (68) | 20 (68) | 21 (70) | 22 (72) | 23 (73) | 23 (73) | 22 (72) | 22 (72) | 22 (72) | 22 (72) | 22 (72) | 20 (68) | 22 (71) |
| Average precipitation mm (inches) | 22 (0.9) | 18 (0.7) | 23 (0.9) | 24 (0.9) | 67 (2.6) | 120 (4.7) | 132 (5.2) | 156 (6.1) | 119 (4.7) | 124 (4.9) | 54 (2.1) | 24 (0.9) | 883 (34.6) |
| Average rainy days | 9.4 | 9.1 | 11.5 | 11.9 | 20.1 | 22.5 | 22.4 | 23.2 | 21.5 | 22.2 | 15.7 | 11.5 | 201 |
| Source: Meteoblue[5] | |||||||||||||
Demographics
| Year | Pop. | ±% p.a. |
|---|---|---|
| 1970 | 13,959 | — |
| 1975 | 14,184 | +0.32% |
| 1980 | 16,359 | +2.89% |
| 1990 | 19,627 | +1.84% |
| 1995 | 14,054 | −6.07% |
| 2000 | 15,269 | +1.79% |
| 2007 | 16,981 | +1.48% |
| 2010 | 18,258 | +2.67% |
| 2015 | 19,205 | +0.97% |
| 2020 | 19,838 | +0.64% |
| Source: Philippine Statistics Authority[6][7][8][9] | ||
Economy
Poverty incidence of San Miguel
10 20 30 40 50 2006 27.70 2009 41.62 2012 46.49 2015 42.98 2018 32.74 2021 31.92 Source: Philippine Statistics Authority[10][11][12][13][14][15][16][17] |
References
- ^ Municipality of San Miguel | (DILG)
- ^ "2015 Census of Population, Report No. 3 – Population, Land Area, and Population Density" (PDF). Philippine Statistics Authority. Quezon City, Philippines. August 2016. ISSN 0117-1453. Archived (PDF) from the original on May 25, 2021. Retrieved July 16, 2021.
- ^ a b Census of Population (2020). "Region IX (Zamboanga Peninsula)". Total Population by Province, City, Municipality and Barangay. Philippine Statistics Authority. Retrieved 8 July 2021.
- ^ "PSA Releases the 2021 City and Municipal Level Poverty Estimates". Philippine Statistics Authority. 2 April 2024. Retrieved 28 April 2024.
- ^ "San Miguel: Average Temperatures and Rainfall". Meteoblue. Retrieved 1 May 2020.
- ^ Census of Population (2015). "Region IX (Zamboanga Peninsula)". Total Population by Province, City, Municipality and Barangay. Philippine Statistics Authority. Retrieved 20 June 2016.
- ^ Census of Population and Housing (2010). "Region IX (Zamboanga Peninsula)" (PDF). Total Population by Province, City, Municipality and Barangay. National Statistics Office. Retrieved 29 June 2016.
- ^ Censuses of Population (1903–2007). "Region IX (Zamboanga Peninsula)". Table 1. Population Enumerated in Various Censuses by Province/Highly Urbanized City: 1903 to 2007. National Statistics Office.
- ^ "Province of Zamboanga del Sur". Municipality Population Data. Local Water Utilities Administration Research Division. Retrieved 17 December 2016.
- ^ "Poverty incidence (PI):". Philippine Statistics Authority. Retrieved December 28, 2020.
- ^ "Estimation of Local Poverty in the Philippines" (PDF). Philippine Statistics Authority. 29 November 2005.
- ^ "2003 City and Municipal Level Poverty Estimates" (PDF). Philippine Statistics Authority. 23 March 2009.
- ^ "City and Municipal Level Poverty Estimates; 2006 and 2009" (PDF). Philippine Statistics Authority. 3 August 2012.
- ^ "2012 Municipal and City Level Poverty Estimates" (PDF). Philippine Statistics Authority. 31 May 2016.
- ^ "Municipal and City Level Small Area Poverty Estimates; 2009, 2012 and 2015". Philippine Statistics Authority. 10 July 2019.
- ^ "PSA Releases the 2018 Municipal and City Level Poverty Estimates". Philippine Statistics Authority. 15 December 2021. Retrieved 22 January 2022.
- ^ "PSA Releases the 2021 City and Municipal Level Poverty Estimates". Philippine Statistics Authority. 2 April 2024. Retrieved 28 April 2024.
External links
- San Miguel Profile at PhilAtlas.com
- Philippine Standard Geographic Code
- Philippine Census Information
- v
- t
- e
Places adjacent to San Miguel, Zamboanga del Sur
| Tigbao | Guipos | |
 | ||
| Lapuyan |  San Miguel San Miguel | Dinas |
 | ||
| Margosatubig | Dimataling |
 Province of Zamboanga del Sur Province of Zamboanga del Sur | |
|---|---|
| Municipalities | |
| Component city | |
| Highly urbanized city |
|
 | This article about a location in Zamboanga Peninsula region is a stub. You can help Wikipedia by expanding it. |
- v
- t
- e


