1994 UK local government election
1994 Bath City Council election | ← 1992 | 5 May 1994 (1994-05-05) | |
|
18 of 48 seats (one third plus two vacant seats) to Bath City Council
25 seats needed for a majority |
|---|
| |
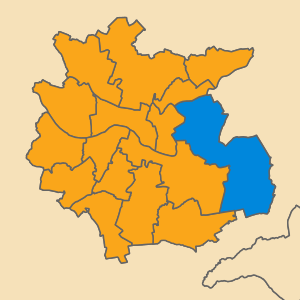 Map showing the results of the 1994 Bath City Council elections. Blue showing Conservative and Orange showing Liberal Democrats. |
Council control before election
No overall control
| Council control after election
Liberal Democrats
| |
The 1994 Bath City Council election was held on Thursday 5 May 1994 to elect councillors to Bath City Council in England. It took place on the same day as other district council elections in the United Kingdom. One third of seats were up for election. Two seats were contested in Lambridge and Lansdown due to extra vacancies occurring.
These were the final elections of the city council, before its abolition on 1 April 1996 when it was merged with Wansdyke District Council to form Bath and North East Somerset Council.
The 1994 election saw the Liberal Democrats take a majority of seats on the Council for the first time, winning 17 of the 18 seats up for election.
Results summary
| Bath City Council election, 1994 |
| Party | This election | Full council | This election |
| Seats | Net | Seats % | Other | Total | Total % | Votes | Votes % | +/− |
| | Liberal Democrats | 17 |  12 12 | 94.4% | 12 | 29 | 60.4% | 19,025 | 54.3% | 16.9% |
| | Conservative | 1 |  7 7 | 5.6% | 16 | 17 | 35.4% | 10,364 | 29.6% | 13.9% |
| | Labour | 0 | 5 | 0% | 2 | 2 | 4.2% | 5,006 | 14.3% | 3.7% |
| | Green | 0 |  | 0% | 0 | 0 | 0% | 630 | 1.8% | 0.8% |
| | Independent | 0 | | 0% | 0 | 0 | 0% | 28 | 0.1% | N/A |
Ward results
Sitting councillors seeking re-election, elected in 1990, are marked with an asterisk (*). The ward results listed below are based on the changes from the 1992 elections, not taking into account any party defections or by-elections.
Abbey
Abbey[1] | Party | Candidate | Votes | % | ±% |
| | Liberal Democrats | Margaret Feeny | 1,105 | 57.3 | +23.8 |
| | Conservative | Jeffrey William Higgins * | 590 | 30.6 | –20.5 |
| | Labour | Gilbert Young | 235 | 12.2 | –3.3 |
| Majority | 515 | 26.7 | |
| Turnout | | 46.4 | |
| Registered electors | 4,169 | | |
| | Liberal Democrats gain from Conservative | Swing | | |
Bathwick
Bathwick[1] | Party | Candidate | Votes | % | ±% |
| | Conservative | John Anthony Bailey | 1,030 | 50.6 | –8.2 |
| | Liberal Democrats | B. Bodle | 822 | 40.4 | +6.4 |
| | Labour | A. Hatwal | 113 | 5.5 | –1.7 |
| | Green | M. Deyes | 72 | 3.5 | N/A |
| Majority | 208 | 10.2 | |
| Turnout | | 45.0 | |
| Registered electors | 4,539 | | |
| | Conservative hold | Swing | | |
Bloomfield
Bloomfield[1] | Party | Candidate | Votes | % | ±% |
| | Liberal Democrats | Stephen Maurice Hogg | 994 | 43.4 | +24.5 |
| | Labour | D. Davis * | 700 | 30.5 | –6.7 |
| | Conservative | A. Dodgson | 598 | 26.1 | –17.8 |
| Majority | 294 | 12.8 | |
| Turnout | | 58.0 | |
| Registered electors | 3,951 | | |
| | Liberal Democrats gain from Labour | Swing | | |
Combe Down
Combe Down[1] | Party | Candidate | Votes | % | ±% |
| | Liberal Democrats | Jeffrey Stephen Manning * | 1,341 | 59.8 | +17.8 |
| | Conservative | S. Edwards | 731 | 32.6 | –19.3 |
| | Labour | S. Richards | 129 | 5.8 | –0.3 |
| | Green | S. Oswald-Bannister | 42 | 1.9 | N/A |
| Majority | 610 | 27.2 | |
| Turnout | | 61.3 | |
| Registered electors | 3,668 | | |
| | Liberal Democrats hold | Swing | | |
Kingsmead
Kingsmead[1] | Party | Candidate | Votes | % | ±% |
| | Liberal Democrats | Andrew Furse | 868 | 51.3 | +29.1 |
| | Conservative | J. Hogan | 584 | 34.5 | –8.2 |
| | Labour | C. Foreman | 240 | 14.2 | –4.0 |
| Majority | 284 | 16.8 | |
| Turnout | | 45.3 | |
| Registered electors | 3,755 | | |
| | Liberal Democrats gain from Conservative | Swing | | |
Lambridge
Lambridge (2 seats)[1] | Party | Candidate | Votes | % | ±% |
| | Liberal Democrats | Ramon David Cliffe | 868 | 48.7 | +24.0 |
| | Liberal Democrats | Michael James Kelleher | 691 | – | |
| | Conservative | D. McDaniel * | 541 | 30.4 | –21.3 |
| | Conservative | D. Snook | 470 | – | |
| | Labour | I. Roker | 217 | 12.2 | –1.4 |
| | Green | J. Rust | 156 | 8.8 | N/A |
| Turnout | | 58.8 | |
| Registered electors | 2,836 | | |
| | Liberal Democrats gain from Conservative | Swing | | |
| | Liberal Democrats gain from Conservative | Swing | | |
Lansdown
Lansdown (2 seats)[1] | Party | Candidate | Votes | % | ±% |
| | Liberal Democrats | Jeff Kenyon | 957 | 44.3 | +18.5 |
| | Liberal Democrats | Richard Allan | 924 | – | |
| | Conservative | P. Buckley * | 908 | 42.0 | –25.1 |
| | Conservative | L. Hayes | 842 | – | |
| | Labour | M. Parr | 165 | 7.6 | +0.5 |
| | Green | P. Andrews | 132 | 6.1 | N/A |
| Turnout | | 53.7 | |
| Registered electors | 3,824 | | |
| | Liberal Democrats gain from Conservative | Swing | | |
| | Liberal Democrats gain from Conservative | Swing | | |
Lyncombe
Lyncombe[1] | Party | Candidate | Votes | % | ±% |
| | Liberal Democrats | Ann Harding | 1,250 | 52.6 | +27.9 |
| | Conservative | George Henry Hall * | 934 | 39.3 | –20.7 |
| | Labour | C. Godwin | 193 | 8.1 | –5.5 |
| Majority | 316 | 13.3 | |
| Turnout | | 58.9 | |
| Registered electors | 4,039 | | |
| | Liberal Democrats gain from Conservative | Swing | | |
Newbridge
Newbridge[1] | Party | Candidate | Votes | % | ±% |
| | Liberal Democrats | Dawn Stollar * | 1,349 | 58.3 | +13.0 |
| | Conservative | Evelyn Hampton | 770 | 33.3 | –16.4 |
| | Labour | Neil Rosser | 193 | 8.3 | +3.3 |
| Majority | 579 | 25.0 | |
| Turnout | | 55.4 | |
| Registered electors | 4,179 | | |
| | Liberal Democrats hold | Swing | | |
Oldfield
Oldfield[1] | Party | Candidate | Votes | % | ±% |
| | Liberal Democrats | Ruth Griffiths | 941 | 48.1 | +22.0 |
| | Labour | Hilary Fraser * | 794 | 40.6 | –10.9 |
| | Conservative | H. Pointer | 193 | 9.9 | –12.4 |
| | Independent | N. Hales | 28 | 1.4 | N/A |
| Majority | 147 | 7.5 | |
| Turnout | | 50.2 | |
| Registered electors | 3,907 | | |
| | Liberal Democrats gain from Labour | Swing | | |
Southdown
Southdown[1] | Party | Candidate | Votes | % | ±% |
| | Liberal Democrats | Marian Hammond * | 1,342 | 74.8 | +9.9 |
| | Labour | H. Lear | 299 | 16.7 | +3.7 |
| | Conservative | J. Corson | 154 | 8.6 | –13.5 |
| Majority | 1,043 | 58.1 | |
| Turnout | | 43.8 | |
| Registered electors | 4,103 | | |
| | Liberal Democrats hold | Swing | | |
Twerton
Twerton[1] | Party | Candidate | Votes | % | ±% |
| | Liberal Democrats | Keith Lunt | 1,061 | 67.4 | +12.1 |
| | Labour | Kathleen Salt * | 408 | 25.9 | –5.8 |
| | Conservative | V. Oliver | 106 | 6.7 | –6.3 |
| Majority | 653 | 41.5 | |
| Turnout | | 44.7 | |
| Registered electors | 3,527 | | |
| | Liberal Democrats gain from Labour | Swing | | |
Walcot
Walcot[1] | Party | Candidate | Votes | % | ±% |
| | Liberal Democrats | Eddie Forrester | 734 | 41.4 | +5.3 |
| | Conservative | Ahmedus Samad Chowdhury | 520 | 29.3 | –10.2 |
| | Labour | B. Barrett | 417 | 23.5 | –1.0 |
| | Green | Richard Scrase | 101 | 5.7 | N/A |
| Majority | 214 | 12.1 | |
| Turnout | | 49.2 | |
| Registered electors | 3,605 | | |
| | Liberal Democrats gain from Labour | Swing | | |
Westmoreland
Westmoreland[1] | Party | Candidate | Votes | % | ±% |
| | Liberal Democrats | N. Winch | 1,164 | 59.3 | +11.2 |
| | Labour | Gillian Wendy Pitman | 571 | 29.1 | –7.0 |
| | Conservative | Susan Gillian Henley Green | 229 | 11.7 | –5.1 |
| Majority | 593 | 30.2 | |
| Turnout | | 49.4 | |
| Registered electors | 3,982 | | |
| | Liberal Democrats gain from Labour | Swing | | |
Weston
Weston[1] | Party | Candidate | Votes | % | ±% |
| | Liberal Democrats | Marthe Cairns * | 1,468 | 61.9 | +13.7 |
| | Conservative | A. Charlton-Porter | 698 | 29.4 | –14.9 |
| | Labour | J. Ross | 143 | 6.0 | –1.5 |
| | Green | S. Bradley | 64 | 2.7 | N/A |
| Majority | 770 | 32.4 | |
| Turnout | | 60.0 | |
| Registered electors | 3,985 | | |
| | Liberal Democrats hold | Swing | | |
Widcombe
Widcombe[1] | Party | Candidate | Votes | % | ±% |
| | Liberal Democrats | Richard Grundy * | 1,146 | 61.5 | +13.4 |
| | Conservative | M. Adams | 466 | 25.0 | –17.9 |
| | Labour | J. Campbell | 189 | 10.1 | –1.1 |
| | Green | S. Hack | 63 | 3.4 | N/A |
| Majority | 680 | 36.5 | |
| Turnout | | 52.0 | |
| Registered electors | 3,587 | | |
| | Liberal Democrats hold | Swing | | |
References
- ^ a b c d e f g h i j k l m n o p "Bath City Council Election Results 1973-1994" (PDF). The Elections Centre (Plymouth University). Retrieved 16 April 2020.

 12
12  7
7 
 Council elections in Somerset


