Local government elections in Derbyshire, England
Amber Valley Borough Council elections are held every four years to elect councillors to Amber Valley Borough Council, the local authority for the non-metropolitan district of Amber Valley in Derbyshire, England. Since the last boundary changes in 2023, 42 councillors have been elected to represent 18 wards. Prior to 2023 a third of the council was elected three years out of every four.[1]
Council election results
The party make up of the council after each election is as shown below.
| Election | Labour | Conservative | Green Party | Liberal Democrats | Independent | BNP | Total | Notes |
| | | | | | |
| 1973 | 33 | 6 | 0 | 3 | 18 | 0 | 60 | Inaugural election |
| 1976 | 18 | 4 | 0 | 14 | 24 | 0 | 60 | |
| 1979 | 18 | 12 | 0 | 7 | 6 | 0 | 43 | New Boundaries |
| 1980 | 24 | 11 | 0 | 4 | 4 | 0 | 43 | |
| 1982 | 22 | 10 | 0 | 7 | 4 | 0 | 43 | |
| 1983 | 23 | 7 | 0 | 8 | 5 | 0 | 43 | |
| 1995 | 37 | 6 | 0 | 0 | 0 | 0 | 43 | |
| 1996 | 37 | 6 | 0 | 0 | 0 | 0 | 43 | |
| 1998 | 37 | 6 | 0 | 0 | 0 | 0 | 43 | |
| 1999 | 32 | 11 | 0 | 0 | 0 | 0 | 43 | |
| 2000 | 12 | 32 | 0 | 0 | 1 | 0 | 45 | New Boundaries |
| 2002 | 19 | 26 | 0 | 0 | 0 | 0 | 45 | |
| 2003 | 25 | 20 | 0 | 0 | 0 | 0 | 45 | |
| 2004 | 24 | 21 | 0 | 0 | 0 | 0 | 45 | |
| 2006 | 18 | 27 | 0 | 0 | 0 | 0 | 45 | |
| 2007 | 17 | 28 | 0 | 0 | 0 | 0 | 45 | |
| 2008 | 14 | 29 | 0 | 0 | 0 | 0 | 45 | |
| 2010 | 14 | 29 | 0 | 0 | 0 | 2 | 45 | |
| 2011 | 15 | 28 | 0 | 0 | 0 | 2 | 45 | |
| 2012 | 21 | 24 | 0 | 0 | 0 | 2 | 45 | |
| 2014 | 23 | 22 | 0 | 0 | 0 | 0 | 45 | |
| 2015 | 21 | 24 | 0 | 0 | 0 | 0 | 45 | |
| 2016 | 22 | 23 | 0 | 0 | 0 | 0 | 45 | |
| 2018 | 20 | 25 | 0 | 0 | 0 | 0 | 45 | |
| 2019 | 25 | 19 | 1 | 0 | 0 | 0 | 45 | |
| 2021 | 16 | 28 | 1 | 0 | 0 | 0 | 45 | |
| 2022 | 11 | 30 | 3 | 0 | 1 | 0 | 45 | |
| 2023 | 26 | 7 | 6 | 1 | 2 | 0 | 42 | New Boundaries |
| | | | | | | | |
Council elections
Borough result maps
-
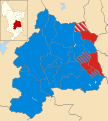
2000 results map
-
2002 results map
-
2003 results map
-
2004 results map
-
2006 results map
-
2007 results map
-
2008 results map
-
2011 results map
-
2012 results map
-
2014 results map
-
2015 results map
-
2016 results map
-
2018 results map
-
2019 results map
-
2021 results map
-
2022 results map
-
2023 results map
By-election results
1994-2000
Riddings By-Election 5 September 1996 | Party | Candidate | Votes | % | ±% |
| | Conservative | | 619 | 48.2 | |
| | Labour | | 545 | 42.5 | |
| | Liberal Democrats | | 119 | 9.3 | |
| Majority | 74 | 5.7 | |
| Turnout | 1,164 | 24.0 | |
| | Conservative gain from Labour | Swing | | |
1997-2001
Alfreton West By-Election 26 June 1997 | Party | Candidate | Votes | % | ±% |
| | Labour | | 354 | 76.5 | −8.3 |
| | Liberal Democrats | | 109 | 23.5 | +8.3 |
| Majority | 245 | 53.0 | |
| Turnout | 463 | 11.8 | |
| | Labour hold | Swing | | |
Wingfield By-Election 16 July 1998 | Party | Candidate | Votes | % | ±% |
| | Conservative | | 372 | 44.7 | +4.2 |
| | Labour | | 259 | 31.1 | −23.1 |
| | Independent | | 165 | 19.8 | +19.8 |
| | Liberal Democrats | | 36 | 4.3 | −2.8 |
| Majority | 113 | 13.6 | |
| Turnout | 832 | 45.0 | |
| | Conservative gain from Labour | Swing | | |
Swanwick By-Election 22 October 1998 | Party | Candidate | Votes | % | ±% |
| | Conservative | | 673 | 68.8 | +23.3 |
| | Labour | | 305 | 31.2 | −23.3 |
| Majority | 368 | 37.6 | |
| Turnout | 978 | 22.9 | |
| | Conservative gain from Labour | Swing | | |
2000-2006
Belper Central By-Election 20 June 2002[7] | Party | Candidate | Votes | % | ±% |
| | Conservative | | 618 | 53.8 | −3.9 |
| | Labour | | 531 | 46.2 | +10.2 |
| Majority | 87 | 7.6 | |
| Turnout | 1,149 | 28.0 | |
| | Conservative hold | Swing | | |
Heage and Ambergate By-Election 8 December 2005[8] | Party | Candidate | Votes | % | ±% |
| | Conservative | | 557 | 52.3 | +3.6 |
| | Labour | | 381 | 35.8 | +5.7 |
| | Liberal Democrats | Tony Cooper | 127 | 11.9 | −9.3 |
| Majority | 176 | 16.5 | |
| Turnout | 1,065 | 24.0 | |
| | Conservative hold | Swing | | |
Heanor & Loscoe By-Election 2 February 2006[9] | Party | Candidate | Votes | % | ±% |
| | Labour | Alan Longdon | 570 | 42.0 | −11.9 |
| | BNP | Paul Snell | 411 | 30.2 | +30.2 |
| | Conservative | Jean Parry | 317 | 23.3 | −22.8 |
| | Liberal Democrats | Sally McIntosh | 61 | 4.5 | +4.5 |
| Majority | 159 | 11.8 | |
| Turnout | 1,359 | 33.0 | |
| | Labour hold | Swing | | |
2006-2010
Ripley & Marehay By-Election 17 September 2009[10] | Party | Candidate | Votes | % | ±% |
| | Labour | Lyndsay D Cox | 585 | 52.4 | +23.7 |
| | Conservative | Matthew C Joyes | 531 | 47.6 | −1.7 |
| Majority | 54 | 4.9 | |
| Turnout | 1,116 | 24.1 | |
| | Labour hold | Swing | 12.6% | |
2010-2014
Codnor & Waingroves by-election, 1st August 2013 | Party | Candidate | Votes | % | ±% |
| | Labour | Isobel Harry (E) | 557 | 52.3 | −5.8 |
| | UKIP | Garry Smith | 250 | 23.5 | +9.6 |
| | Conservative | Ron Ashton | 219 | 20.6 | −3.3 |
| | Liberal Democrats | Keith Falconbridge | 39 | 3.7 | +3.7 |
| Majority | 307 | 28.8 | |
| Turnout | | 26.8 | |
| | Labour hold | Swing | | |
Heanor East by-election, 30th January 2014 | Party | Candidate | Votes | % | ±% |
| | Labour | Sheila Oaks (E) | 548 | 58.4 | +8.4 |
| | Conservative | Steven Grainger | 350 | 37.3 | +11.0 |
| | Liberal Democrats | Kate Smith | 41 | 4.4 | −0.2 |
| Majority | 198 | 21.1 | |
| Turnout | | 18.6 | |
| | Labour hold | Swing | | |
Heanor West by-election, 13th March 2014 | Party | Candidate | Votes | % | ±% |
| | Labour | Celia Cox (E) | 595 | 52.9 | −3.3 |
| | UKIP | Philip Rose | 259 | 23.0 | +23.0 |
| | Conservative | Mark Burrell | 229 | 20.4 | −5.2 |
| | Liberal Democrats | Kate Smith | 41 | 3.6 | +3.6 |
| Majority | 336 | 29.9 | |
| Turnout | | 23.3 | |
| | Labour hold | Swing | | |
2018-2022
Wingfield By-Election 15 December 2022 | Party | Candidate | Votes | % | ±% |
| | Conservative | Dawn Harper | 242 | 54.9 | −13.9 |
| | Liberal Democrats | Kate Smith | 114 | 25.9 | +21.4 |
| | Labour | Dean Watson | 53 | 12.0 | −7.2 |
| | Green | Sally Lowick | 32 | 7.3 | −0.2 |
| Majority | 128 | 29.0 | |
| Turnout | 441 | 22.9 | |
| | Conservative hold | Swing | | |
2023-2027
Crich & South Wingfield By-Election 2 May 2024 | Party | Candidate | Votes | % | ±% |
| | Conservative | Tony Harper | 617 | 35.9 | −2.4 |
| | Liberal Democrats | Marcus Johnson | 434 | 25.2 | −12.1 |
| | Labour | Amy Trewick | 428 | 24.9 | +11.0 |
| | Green | Fiona Horton | 240 | 14.0 | +1.1 |
| Majority | 183 | 10.7 | |
| Turnout | 1719 | 41.1 | |
| | Conservative hold | Swing | | |
References
- ^ "The Amber Valley (Electoral Changes) Order 2022", legislation.gov.uk, The National Archives, SI 2022/810, retrieved 21 August 2022
- ^ The District of Amber Valley (Electoral Arrangements) Order 1978
- ^ The Derbyshire and Nottinghamshire (Areas) Order 1985
- ^ legislation.gov.uk - The Derbyshire and Nottinghamshire (County Boundaries) Order 1992. Retrieved on 5 November 2015.
- ^ "Amber Valley". BBC Online. Retrieved 7 August 2008.
- ^ "UK Government Web Archive". webarchive.nationalarchives.gov.uk. Retrieved 10 May 2023.
- ^ "Swing to Labour reverses Tory lead". guardian.co.uk. London. 21 June 2002. Retrieved 25 March 2010.
- ^ "Tories make first gain of Cameron era". guardian.co.uk. London. 9 December 2005. Retrieved 5 September 2009.
- ^ "New gloss hides old race claims". Nottingham Evening Post. 3 February 2006.
- ^ "Ripley and Marehay by-election results announced". thisis derbyshire.co.uk. 18 September 2009. Retrieved 21 September 2009.
External links
 2000 results map
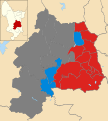 2002 results map
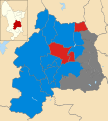 2003 results map
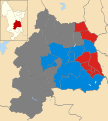 2004 results map
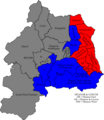 2006 results map
 2007 results map
 2008 results map
 2011 results map
 2012 results map
 2014 results map
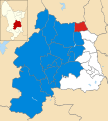 2015 results map
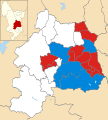 2016 results map
 2018 results map
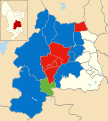 2019 results map
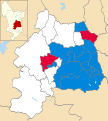 2021 results map
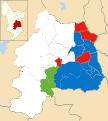 2022 results map
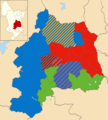 2023 results map


 Council elections in Derbyshire


