2004 UK local government election
Elections to Gosport Council were held on 10 June 2004. Half of the council was up for election, and the council stayed under no overall control.
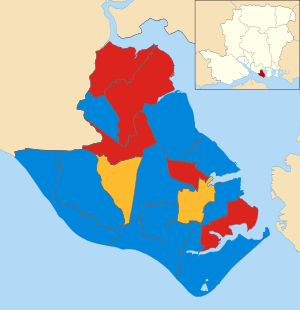
After the election, the composition of the council was
- Conservative: 15
- Labour: 11
- Liberal Democrat: 5
- Others: 3
Election result
Gosport Local Election Result 2004 | Party | Seats | Gains | Losses | Net gain/loss | Seats % | Votes % | Votes | +/− |
| | Conservative | 10 | 4 | 0 | +4 | 58.8 | 56.2 | 11,748 | +16.2% |
| | Labour | 5 | 0 | 1 | -1 | 29.4 | 27.2 | 5,681 | -5.7% |
| | Liberal Democrats | 2 | 0 | 3 | -3 | 11.8 | 13.6 | 2,854 | -13.4% |
| | UKIP | 0 | 0 | 0 | 0 | 0 | 2.0 | 426 | +1.8% |
| | Green | 0 | 0 | 0 | 0 | 0 | 1.0 | 213 | +1.0% |
Ward results
Alverstoke
Alverstoke | Party | Candidate | Votes | % | ±% |
| | Conservative | Philip Clinton | 1,323 | 81.3 | |
| | Labour | Robert Salter | 304 | 18.7 | |
| Majority | 1,019 | 62.6 | |
| Turnout | 1,627 | | |
| | Conservative hold | Swing | | |
Anglesey
Anglesey | Party | Candidate | Votes | % | ±% |
| | Conservative | Mark Hook | 1,034 | 75.9 | |
| | Labour | Jennifer Hall | 328 | 24.1 | |
| Majority | 706 | 51.8 | |
| Turnout | 1,362 | | |
| | Conservative hold | Swing | | |
Bridgemary North
Bridgemary North | Party | Candidate | Votes | % | ±% |
| | Labour | Martyn Davis | 643 | 57.6 | |
| | Conservative | Joanne Watts | 473 | 42.4 | |
| Majority | 170 | 15.2 | |
| Turnout | 1,116 | | |
| | Labour hold | Swing | | |
Bridgemary South
Bridgemary South | Party | Candidate | Votes | % | ±% |
| | Labour | Jill Wright | 727 | 61.4 | |
| | Conservative | Robert Perris | 457 | 38.6 | |
| Majority | 270 | 22.8 | |
| Turnout | 1,184 | | |
| | Labour hold | Swing | | |
Brockhurst
Brockhurst | Party | Candidate | Votes | % | ±% |
| | Conservative | Ivor Foster | 681 | 53.5 | |
| | Liberal Democrats | Michael Russell | 385 | 30.3 | |
| | Labour | James Fox | 206 | 16.2 | |
| Majority | 296 | 23.2 | |
| Turnout | 1,272 | | |
| | Conservative gain from Liberal Democrats | Swing | | |
Christchurch
Christchurch | Party | Candidate | Votes | % | ±% |
| | Conservative | Richard Dickson | 564 | 44.3 | |
| | Liberal Democrats | Austin Hicks | 362 | 28.4 | |
| | Labour | Diane Searle | 348 | 27.3 | |
| Majority | 202 | 15.9 | |
| Turnout | 1,274 | | |
| | Conservative gain from Liberal Democrats | Swing | | |
Elson
Elson | Party | Candidate | Votes | % | ±% |
| | Conservative | Bruce Rigg | 624 | 47.0 | |
| | Liberal Democrats | Laura Elshaw | 415 | 31.3 | |
| | UKIP | Francis Bridgewater | 167 | 12.6 | |
| | Labour | Jill Whitcher | 101 | 7.6 | |
| Majority | 209 | 15.7 | |
| Turnout | 1,327 | | |
| | Conservative gain from Liberal Democrats | Swing | | |
Forton
Forton | Party | Candidate | Votes | % | ±% |
| | Labour | Keith Farr | 410 | 40.5 | |
| | Liberal Democrats | Gary Elshaw | 303 | 29.9 | |
| | Conservative | Anna Oliver | 300 | 29.6 | |
| Majority | 107 | 10.6 | |
| Turnout | 1,013 | | |
| | Labour hold | Swing | | |
Grange
Grange | Party | Candidate | Votes | % | ±% |
| | Liberal Democrats | Nina Champion | 239 | 36.8 | |
| | Labour | Victor Burt | 222 | 34.2 | |
| | Conservative | Hugh Landels | 188 | 29.0 | |
| Majority | 17 | 2.6 | |
| Turnout | 649 | | |
| | Liberal Democrats hold | Swing | | |
Hardway
Hardway | Party | Candidate | Votes | % | ±% |
| | Conservative | Peter Langdon | 822 | 66.1 | |
| | Green | Andrea Smith | 213 | 17.1 | |
| | Labour | Peter Bell | 209 | 16.8 | |
| Majority | 609 | 49.0 | |
| Turnout | 1,244 | | |
| | Conservative hold | Swing | | |
Lee East
Lee East | Party | Candidate | Votes | % | ±% |
| | Conservative | Howard Burgess | 966 | 83.0 | |
| | Labour | John Madgwick | 198 | 17.0 | |
| Majority | 768 | 66.0 | |
| Turnout | 1,164 | | |
| | Conservative hold | Swing | | |
Lee West
Lee West | Party | Candidate | Votes | % | ±% |
| | Conservative | Brian Taylor | 1,326 | 81.9 | |
| | Labour | Michael Madgwick | 294 | 18.1 | |
| Majority | 1,032 | 63.8 | |
| Turnout | 1,620 | | |
| | Conservative hold | Swing | | |
Leesland
Leesland | Party | Candidate | Votes | % | ±% |
| | Liberal Democrats | David Smith | 529 | 48.9 | |
| | Conservative | Marjorie Bailey | 380 | 35.1 | |
| | Labour | Alan Durrant | 173 | 16.0 | |
| Majority | 149 | 13.8 | |
| Turnout | 1,082 | | |
| | Liberal Democrats hold | Swing | | |
Peel Common
Peel Common | Party | Candidate | Votes | % | ±% |
| | Conservative | Stephen Philpott | 896 | 57.6 | |
| | Labour | Peter Russell | 401 | 25.8 | |
| | UKIP | John Bowles | 259 | 16.6 | |
| Majority | 495 | 31.8 | |
| Turnout | 1,556 | | |
| | Conservative gain from Labour | Swing | | |
Privett
Privett | Party | Candidate | Votes | % | ±% |
| | Conservative | Colin Jacobs | 865 | 63.0 | |
| | Liberal Democrats | Josephine Jackson | 348 | 25.3 | |
| | Labour | Dennis Gough | 161 | 11.7 | |
| Majority | 517 | 37.7 | |
| Turnout | 1,374 | | |
| | Conservative hold | Swing | | |
Rowner & Holbrook
Rowner & Holbrook | Party | Candidate | Votes | % | ±% |
| | Labour | John Train | 326 | 35.6 | |
| | Conservative | Thelma Morrison | 317 | 34.6 | |
| | Liberal Democrats | Wayne Richards | 273 | 29.8 | |
| Majority | 9 | 1.0 | |
| Turnout | 916 | | |
| | Labour hold | Swing | | |
Town
Town | Party | Candidate | Votes | % | ±% |
| | Labour | Neil Redrup | 630 | 54.2 | |
| | Conservative | Michael Geddes | 532 | 45.8 | |
| Majority | 98 | 8.4 | |
| Turnout | 1,162 | | |
| | Labour hold | Swing | | |
References
- 2004 Gosport election result
- Ward results