1953 UK local election
1953 Liverpool City Council election
|
|
| |
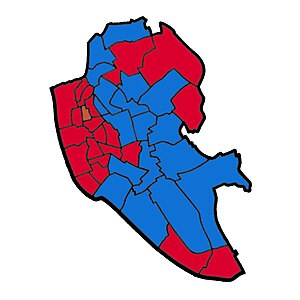 Map of Liverpool showing wards won (first placed party)[1] |
Elections to Liverpool City Council were held on 7 May 1953.
After the election, the composition of the council was:
| Party | Councillors | ± | Aldermen | Total |
| | Conservative | 53 | -14 | 28 | 81 |
| | Labour | 65 | +19 | 7 | 72 |
| | Protestant | 2 | -2 | 1 | 3 |
| | Liberal | 0 | 0 | 2 | 2 |
Election result
Liverpool Local Election Result 1953 | Party | Seats | Gains | Losses | Net gain/loss | Seats % | Votes % | Votes | +/− |
| | Conservative | 53 | | | | | 49% | 120,667 | |
| | Labour | 65 | | | | | 43% | 117,333 | |
| | Protestant | 3 | | | | | 2.1% | 5,090 | |
| | Liberal | 0 | 0 | 0 | 0 | 0% | 0.14% | 341 | |
| | Democratic Labour | 0 | 0 | 0 | 0 | 0% | 0.41% | 1,013 | |
| | Ind. Conservative | 0 | 0 | 0 | 0 | 0% | 0.26% | 648 | |
| | Communist | 0 | 0 | 0 | 0 | 0% | 0.12% | 301 | |
Ward results
* - Councillor seeking re-election
(PARTY) - Party of former Councillor
This was the first election with new boundaries since the 1952 election.
Deleted ward names : Brunswick, Castle Street, Edge Hill, Exchange, Garston, Great George, Kirkdale, Little Woolton, Much Woolton, North Scotland, St. Anne's, St. Peter's, Sefton Park East, Sefton Park West, South Scotland, Walton, Wavertree, Wavertree West and West Derby.
New ward names : Arundel, Broadgreen, Central, Church, Clubmoor, County, Gillmoss, Melrose, Picton, Pirrie, St. James', St. Mary's, St. Michael's, Smithdown, Speke, Tuebrook, Westminster and Woolton.
This was an 'all up' election were three councillors were elected for each ward. The term of office for the councillor with the largest number of votes in each ward was three years. The councillor with the second highest number of votes was elected for two years, and the councillor with the third highest number of votes in each ward was elected for one year. Comparisons are made with the election results for the year when the sitting councillor was elected, although boundary changes make these comparisons of limited use.
Abercromby
Abercromby - 3 seats | Party | Candidate | Votes | % | ±% |
| | Labour | H. Livermore * | 3,300 | 59 | −3 |
| | Labour | T. G. D. Maguire | 3,130 | 56 | |
| | Labour | L. Murphy | 3,115 | 55 | |
| | Conservative | J. Cheshire * | 2,335 | 41 | −10 |
| | Conservative | Abram Maxwell Caplin | 2,256 | 40 | +2 |
| | Conservative | F. J. Bullen * | 2,231 | 40 | −13 |
| Majority | 965 | | |
| Registered electors | 12,845 | | |
| Turnout | 5,635 | 44 | |
| | Labour gain from Conservative | Swing | | |
| | Labour gain from Conservative | Swing | | |
| | Labour hold | Swing | | |
Aigburth
Aigburth - 3 seats | Party | Candidate | Votes | % | ±% |
| | Conservative | H. M. Allen * | 5,578 | 89% | +6% |
| | Conservative | W. A. Kinnear * | 5,551 | 89% | +13% |
| | Conservative | G. S. Fulton (PARTY) | 5,437 | 87% | +6% |
| | Labour | W. Rice-Jones | 680 | 11% | −3% |
| | Labour | T. G. White | 609 | 10% | −4% |
| | Labour | R. Hunter | 567 | 9% | −5% |
| Majority | 4,898 | | |
| Registered electors | 14,022 | | |
| Turnout | 6,258 | 45% | 0% |
| | Conservative hold | Swing | | |
| | Conservative hold | Swing | | |
| | Conservative hold | Swing | | |
Allerton
Allerton - 3 seats | Party | Candidate | Votes | % | ±% |
| | Conservative | C. Haswell * | 3,199 | 81% | +7% |
| | Conservative | Mrs. M. J. Strong * | 3,137 | 79% | +3% |
| | Conservative | J. McMillan * | 3,124 | 79% | |
| | Labour | B. Deane | 759 | 19% | −7% |
| | Labour | A.Dunford | 742 | 19% | −7% |
| | Labour | G. M. Scott | 675 | 17% | −9% |
| Majority | 2,440 | | |
| Registered electors | 9,742 | | |
| Turnout | 3,958 | 41% | +1% |
| | Conservative hold | Swing | | |
| | Conservative hold | Swing | | |
| | Conservative hold | Swing | | |
Anfield
Anfield - 3 seats | Party | Candidate | Votes | % | ±% |
| | Conservative | R. F. Craine (PARTY) | 4,935 | 64% | −5% |
| | Conservative | A. J. White * | 4,818 | 63% | −5% |
| | Conservative | N. A. Pannell * | 4,796 | 62% | +9% |
| | Labour | G. McCartney | 2,756 | 36% | −11% |
| | Labour | W. K. Fox | 2,755 | 36% | −11% |
| | Labour | R. G. Bale | 2,741 | 36% | −11% |
| Majority | 2,179 | | |
| Registered electors | 15,956 | | |
| Turnout | 7,691 | 48% | +2% |
| | Conservative hold | Swing | | |
| | Conservative hold | Swing | | |
| | Conservative hold | Swing | | |
Arundel
Arundel - 3 seats | Party | Candidate | Votes | % | ±% |
| | Conservative | W. I. Throssell * | 3,782 | 64% | |
| | Conservative | H. Lees * | 3,714 | 63% | |
| | Conservative | J. N. M. Entwistle * | 3,627 | 61% | |
| | Labour | A. Young | 2,133 | 36% | |
| | Labour | T. McManus | 2,113 | 36% | |
| | Labour | E. M. Mannheim | 2,085 | 35% | |
| Majority | 1,649 | | |
| Registered electors | 13,355 | | |
| Turnout | 5,915 | 44% | |
| | Conservative hold | Swing | | |
| | Conservative hold | Swing | | |
| | Conservative hold | Swing | | |
The successful candidates for Arundel were previously elected for the Sefton Park East wards under the previous ward boundaries in 1950, 1951 and 1952.
Breckfield
Breckfield - 3 seats | Party | Candidate | Votes | % | ±% |
| | Conservative | S. Curtis (PARTY) | 2,973 | 52% | |
| | Conservative | W. B. Pickett (PARTY) | 2,923 | 51% | |
| | Conservative | J. S. Ross | 2,848 | 50% | |
| | Labour | W. R. Snell * | 2,743 | 48% | −7% |
| | Labour | A. T. F. Williams | 2,668 | 47% | |
| | Labour | J. Cullen | 2,639 | 46% | |
| Majority | 230 | | |
| Registered electors | 12,697 | | |
| Turnout | 5,716 | 45% | +1% |
| | Conservative hold | Swing | | |
| | Conservative hold | Swing | | |
| | Conservative gain from Labour | Swing | | |
Broadgreen
Broadgreen - 3 seats | Party | Candidate | Votes | % | ±% |
| | Conservative | L. H. Sanders | 3,912 | 63% | |
| | Conservative | L. T. Rogers | 3,860 | 63% | |
| | Conservative | L. S. Allen | 3,773 | 61% | |
| | Labour | G. Sykes | 2,258 | 37% | |
| | Labour | J. H. Goodenough | 2,176 | 35% | |
| | Labour | G. H. Dunbar | 2,143 | 35% | |
| Majority | 1,654 | | |
| Registered electors | 12,700 | | |
| Turnout | 6,170 | 49% | |
| | Conservative hold | Swing | | |
| | Conservative hold | Swing | | |
| | Conservative hold | Swing | | |
Central
Central - 3 seats | Party | Candidate | Votes | % | ±% |
| | Labour | Mrs. E. M. Braddock | 3,008 | 40% | |
| | Labour | J. Cullen | 2,951 | 39% | |
| | Labour | W. McKeown | 2,805 | 37% | |
| | Independent | J. G. Granby | 2,339 | 31% | |
| | Conservative | J. O. Tiernan | 2,139 | 29% | |
| | Independent | J. Larkin | 2,075 | 28% | |
| Majority | 869 | | |
| Registered electors | 10,799 | | |
| Turnout | 7,486 | 69% | |
| | Labour hold | Swing | | |
| | Labour hold | Swing | | |
| | Labour hold | Swing | | |
Childwall
Childwall- 3 seats | Party | Candidate | Votes | % | ±% |
| | Conservative | W.J.Sergent * | 4,916 | 85% | +6% |
| | Conservative | A. Young * | 4,901 | 85% | −1% |
| | Conservative | J. S. Brown * | 4,878 | 85% | +1% |
| | Labour | A. J. Keeley | 851 | 15% | −6% |
| | Labour | J. O'Brien | 847 | 15% | −6% |
| | Labour | J. Fraser | 846 | 15% | −6% |
| Majority | 4,065 | | |
| Registered electors | 13,946 | | |
| Turnout | 5,767 | 41% | −1% |
| | Conservative hold | Swing | | |
| | Conservative hold | Swing | | |
| | Conservative hold | Swing | | |
Church
Church - 3 seats | Party | Candidate | Votes | % | ±% |
| | Conservative | Mrs.E.B.Glazebrook | 5,280 | 83% | |
| | Conservative | E. Jennings | 5,244 | 82% | |
| | Conservative | H. M. Steward | 5,069 | 79% | |
| | Labour | W. Smyth | 1,100 | 17% | |
| | Labour | W. J. Wright | 1,050 | 16% | |
| | Labour | G. W. Clarke | 999 | 16% | |
| Majority | 4,180 | | |
| Registered electors | 14,740 | | |
| Turnout | 6,380 | 43% | |
| | Conservative hold | Swing | | |
| | Conservative hold | Swing | | |
| | Conservative hold | Swing | | |
Clubmoor
Clubmoor - 3 seats | Party | Candidate | Votes | % | ±% |
| | Conservative | L. J. Carr | 3,502 | 54% | |
| | Conservative | N. A. Williams | 3.439 | 53% | |
| | Conservative | F.H.Wilson | 3,397 | 53% | |
| | Labour | A. C. McLeod | 2,967 | 46% | |
| | Labour | M. James | 2,887 | 45% | |
| | Labour | H. F. Welsh | 2,826 | 44% | |
| Majority | 535 | | |
| Registered electors | 12,876 | | |
| Turnout | 6,469 | 50% | |
| | Conservative hold | Swing | | |
| | Conservative hold | Swing | | |
| | Conservative hold | Swing | | |
County
County - 3 seats | Party | Candidate | Votes | % | ±% |
| | Conservative | Mrs. M. E. Jones | 4,188 | 51% | |
| | Conservative | G.Moore | 4,045 | 49% | |
| | Labour | H. Dailey | 4,003 | 49% | |
| | Labour | R. Stoddart | 3,994 | 49% | |
| | Conservative | R. Andrews | 3,982 | 49% | |
| | Labour | J. A. B. Deane | 3,900 | 48% | |
| Majority | | | |
| Registered electors | 15,702 | | |
| Turnout | 8,191 | 52% | |
| | Conservative hold | Swing | | |
| | Conservative hold | Swing | | |
| | Labour hold | Swing | | |
Croxteth
Croxteth - 3 seats | Party | Candidate | Votes | % | ±% |
| | Conservative | N. A. Williams | 4,391 | 77% | +27% |
| | Conservative | T. H. Thompson | 4,332 | 76% | |
| | Conservative | J. G. Hughes | 4,215 | 74% | |
| | Labour | N. Smith | 1,301 | 23% | |
| | Labour | E.Maguire | 1,195 | 21% | |
| | Labour | W.A.Robinson | 1,194 | 21% | |
| Majority | 3,090 | | |
| Registered electors | 10,258 | | |
| Turnout | 5,692 | 55% | +10% |
| | Conservative hold | Swing | | |
| | Conservative hold | Swing | | |
| | Conservative gain from Labour | Swing | | |
Dingle
Dingle - 3 seats | Party | Candidate | Votes | % | ±% |
| | Labour | W. F. Aldis * | 5,059 | 60% | −5% |
| | Labour | F. H. Cain (PARTY) | 4,627 | 55% | −10% |
| | Labour | L. C. Edwards | 4,519 | 54% | −11% |
| | Conservative | S. Airey * | 3,347 | 40% | −11% |
| | Conservative | H. B. Allison | 3,338 | 40% | +5% |
| | Conservative | E. Johnson | 2,953 | 35% | 0% |
| Majority | 1,712 | | |
| Registered electors | 15,438 | | |
| Turnout | 8,406 | 54% | +1% |
| | Labour hold | Swing | | |
| | Labour gain from Conservative | Swing | | |
| | Labour hold | Swing | | |
Dovecot
Dovecot - 3 seats | Party | Candidate | Votes | % | ±% |
| | Labour | W. P. Johnson | 4,232 | 58% | |
| | Labour | T. H. Maloney | 4,216 | 58% | |
| | Labour | L. Caplan | 4,153 | 57% | |
| | Conservative | Sydney Smart | 3,006 | 42% | |
| | Conservative | J. P. Moyses | 2,969 | 41% | |
| | Conservative | D. E. Williams | 2,947 | 41% | |
| Majority | 1,226 | | |
| Registered electors | 15,171 | | |
| Turnout | 7,238 | 48% | |
Everton
Everton - 3 seats | Party | Candidate | Votes | % | ±% |
| | Labour | J. B. Braddock * | 3,767 | 71% | +13% |
| | Labour | J. L. Hughes * | 3,753 | 71% | −6% |
| | Labour | D. Nickson * | 3,591 | 68% | +4% |
| | Conservative | A. W. Carter | 1,502 | 29% | |
| | Conservative | W. Martin | 1,409 | 27% | |
| | Conservative | E. D. Minshull | 1,375 | 26% | |
| Majority | 2,265 | | |
| Registered electors | 13,443 | | |
| Turnout | 5,269 | 39% | +1% |
| | Labour hold | Swing | | |
| | Labour hold | Swing | | |
| | Labour hold | Swing | | |
Fairfield
Fairfield- 3 seats | Party | Candidate | Votes | % | ±% |
| | Conservative | R. Meadows * | 4,079 | 57% | −8% |
| | Conservative | R. Nash * | 3,959 | 55% | −12% |
| | Conservative | W. Thomas * | 3,910 | 54% | −1% |
| | Labour | H. Lee | 3,123 | 43% | −2% |
| | Labour | J. M. Campbell | 3,109 | 43% | −2% |
| | Labour | N. Beresford | 3,034 | 42% | −3% |
| Majority | 956 | | |
| Registered electors | 15,611 | | |
| Turnout | 7,202 | 46% | +6% |
| | Conservative hold | Swing | | |
| | Conservative hold | Swing | | |
| | Conservative hold | Swing | | |
Fazakerley
Fazakerley - 3 seats | Party | Candidate | Votes | % | ±% |
| | Conservative | K. P. Thompson * | 4,100 | 58% | |
| | Conservative | R. Poole | 4,079 | 57% | |
| | Conservative | R. Rattray | 4,026 | 56% | |
| | Labour | E. Jarvis | 3,027 | 42% | |
| | Labour | T. McNerney | 2,987 | 42% | |
| | Labour | J. H. Sommerville | 2,870 | 40% | |
| Majority | 1,073 | | |
| Registered electors | 13,112 | | |
| Turnout | 7,127 | 54% | |
| | Conservative gain from Labour | Swing | | |
| | Conservative hold | Swing | | |
| | Conservative gain from Labour | Swing | | |
Gillmoss
Gillmoss - 3 seats | Party | Candidate | Votes | % | ±% |
| | Labour | C. McDonald | 4,000 | 65% | |
| | Labour | J. Troy | 3,805 | 62% | |
| | Labour | I. I. Levin | 3,784 | 61% | |
| | Conservative | L. J. H. Rumsey | 2,165 | 35% | |
| | Conservative | H. M. Dobie | 2,143 | 35% | |
| | Conservative | W. A, Cliffe | 2,100 | 34% | |
| Majority | 1,835 | | |
| Registered electors | 14,074 | | |
| Turnout | 6,165 | 44% | |
Granby
Granby - 3 seats | Party | Candidate | Votes | % | ±% |
| | Labour | Mrs. E. Trainor | 3,270 | 55% | |
| | Labour | W. T. Brodie * | 3,244 | 55% | |
| | Labour | J. Guinan | 3,185 | 54% | −7% |
| | Conservative | R. J. McLaughlin | 2,639 | 45% | |
| | Conservative | J. E. Thompson * | 2,570 | 43% | −12% |
| | Conservative | T. Beattie-Edwards | 2,352 | 40% | |
| Majority | 631 | | |
| Registered electors | 12,754 | | |
| Turnout | 5,909 | 46% | +2% |
| | Labour hold | Swing | | |
| | Labour gain from Conservative | Swing | | |
| | Labour gain from Conservative | Swing | | |
Kensington
Kensington - 3 seats | Party | Candidate | Votes | % | ±% |
| | Labour | F. Walker * | 3,552 | 55% | −4% |
| | Labour | Mrs. E. M. Wormald | 3,400 | 52% | |
| | Labour | T. K. Williams | 3,395 | 52% | |
| | Conservative | S. Minion * | 2,951 | 45% | −9% |
| | Conservative | H. W. Hughes * | 2,947 | 45% | −6% |
| | Conservative | A. E. Holloway | 2,781 | 43% | |
| Majority | 601 | | |
| Registered electors | 13,799 | | |
| Turnout | 6,503 | 47% | +3% |
| | Labour hold | Swing | | |
| | Labour gain from Conservative | Swing | | |
| | Labour gain from Conservative | Swing | | |
Low Hill
Low Hill - 3 seats | Party | Candidate | Votes | % | ±% |
| | Labour | F. Robinson * | 3,064 | 54% | −11% |
| | Labour | Mrs. M. J. Powell (PARTY) | 2,950 | 52% | −13% |
| | Labour | J. M. Taylor | 2,923 | 51% | −14% |
| | Conservative | G. Dugdale (PARTY) | 2,010 | 35% | −20% |
| | Conservative | W. A. Cassidy | 2,003 | 35% | 0% |
| | Conservative | G. P. Brewer | 1,878 | 33% | −2% |
| | Ind. Conservative | Mrs. M. Brook | 648 | 11% | |
| Majority | 1,054 | | |
| Registered electors | 11,501 | | |
| Turnout | 5,772 | 50% | +6% |
| | Labour hold | Swing | | |
| | Labour gain from Conservative | Swing | | |
| | Labour hold | Swing | | |
Melrose
Melrose - 3 seats | Party | Candidate | Votes | % | ±% |
| | Labour | P. J. O'Hare | 3,000 | 65% | |
| | Labour | H. James | 2,719 | 59% | |
| | Labour | C. H. Browne | 2,691 | 59% | |
| | Conservative | J. A. Fergus | 1,588 | 35% | |
| | Conservative | J. Smith | 1,576 | 34% | |
| | Conservative | F. Rhind | 1,532 | 33% | |
| Majority | 1,412 | | |
| Registered electors | 10,956 | | |
| Turnout | 4,588 | 42% | |
Netherfield
Netherfield - 3 seats | Party | Candidate | Votes | % | ±% |
| | Protestant | J. Dorman | 2,237 | 55% | |
| | Protestant | G. E. Lewis * | 2,198 | 54% | −13% |
| | Conservative and Protestant | H. V. Shaw * | 2,125 | 52% | −10% |
| | Labour | R. Clitherow '* | 1,831 | 45% | −10% |
| | Labour | T. Robinson | 1,743 | 44% | −11% |
| | Labour | J. J. Brayton | 1,664 | 41% | −14% |
| Majority | 406 | | |
| Registered electors | 10,129 | | |
| Turnout | 4,068 | 40% | +6% |
| | Protestant gain from Labour | Swing | | |
| | Protestant hold | Swing | | |
| | Protestant hold | Swing | | |
Old Swan
Old Swan- 3 seats | Party | Candidate | Votes | % | ±% |
| | Conservative | A. N. Bates * | 3,966 | 50.5% | −20% |
| | Conservative | B. M. Frazer (PARTY) | 3,921 | 49.9% | −4% |
| | Labour | J. G. Devine | 3,892 | 49.5% | +4% |
| | Conservative | C. J. Hill (PARTY) | 3,863 | 49.2% | −5% |
| | Labour | J. Mooney | 3,830 | 48.7% | +3% |
| | Labour | J. Tudor | 3,763 | 47.9% | +3% |
| Majority | 74 | | |
| Registered electors | 16,872 | | |
| Turnout | 7,858 | 47% | +7% |
| | Conservative hold | Swing | | |
| | Conservative hold | Swing | | |
| | Labour gain from Conservative | Swing | | |
Picton
Picton - 3 seats | Party | Candidate | Votes | % | ±% |
| | Labour | C. J. Minton | 4,181 | 53% | |
| | Labour | F. Burke | 3,989 | 51% | |
| | Labour | R. E. Jackson | 3,964 | 51% | |
| | Conservative | J. Keenan | 3,656 | 47% | |
| | Conservative | J. N. Rutter | 3,518 | 45% | |
| | Conservative | G. F. Allanson | 3,496 | 45% | |
| Majority | 525 | | |
| Registered electors | 15,567 | | |
| Turnout | 7,837 | 50% | |
Pirrie
Pirrie - 3 seats | Party | Candidate | Votes | % | ±% |
| | Labour | H. Dalton | 5,315 | 58% | |
| | Labour | J. Morgan | 5,311 | 57% | |
| | Labour | W. Dalgarno | 5,223 | 57% | |
| | Conservative | G. Clark | 3,923 | 42% | |
| | Conservative | Mrs. F. M. James | 3,917 | 42% | |
| | Conservative | W. A. Sawle | 3,881 | 42% | |
| Majority | 1,392 | | |
| Registered electors | 17,708 | | |
| Turnout | 9,238 | 52% | |
Prince's Park
Prince's Park - 3 seats | Party | Candidate | Votes | % | ±% |
| | Labour | J. Sidwell (PARTY) | 3,647 | 52% | −7% |
| | Labour | T. C. Greenwood | 3,637 | 52% | −7% |
| | Labour | T. Roberts | 3,576 | 51% | −8% |
| | Conservative | C. A. Lever | 3,351 | 48% | +7% |
| | Conservative | C. Cowlin * | 3,305 | 47% | −9% |
| | Conservative | W. Browne * | 3,227 | 46% | −8% |
| Majority | 296 | | |
| Registered electors | 14,614 | | |
| Turnout | 6,998 | 48% | +2% |
| | Labour hold | Swing | | |
| | Labour gain from Conservative | Swing | | |
| | Labour gain from Conservative | Swing | | |
Sandhills
Sandhills - 3 seats | Party | Candidate | Votes | % | ±% |
| | Labour | P. McKernan * | 3,038 | 80% | |
| | Labour | S. Part * | 2,825 | 74% | +18% |
| | Labour | H. Aldritt * | 2,727 | 72% | −7% |
| | Conservative | J. McQuade | 757 | 20% | |
| Majority | 2,281 | | |
| Registered electors | 9,978 | | |
| Turnout | 3,795 | 38% | 0% |
| | Labour hold | Swing | | |
| | Labour hold | Swing | | |
| | Labour hold | Swing | | |
St. Domingo
St. Domingo - 3 seats | Party | Candidate | Votes | % | ±% |
| | Labour | F. Keating | 3,206 | 53% | +4% |
| | Labour | J. Gardner | 3,117 | 51% | +2% |
| | Labour | W. R. Maylor | 2,992 | 49% | 0% |
| | Protestant | Mrs. M. J. Longbottom * | 2,853 | 47% | −18% |
| | Protestant | R. F. Henderson (PARTY) | 2,846 | 47% | −4% |
| | Protestant | W. H. Wilkes (PARTY) | 2,702 | 45% | −6% |
| Majority | 353 | | |
| Registered electors | 13,279 | | |
| Turnout | 6,059 | 46% | +10% |
| | Labour gain from Protestant | Swing | | |
| | Labour gain from Protestant | Swing | | |
| | Labour gain from Protestant | Swing | | |
St. James
St. James' - 3 seats | Party | Candidate | Votes | % | ±% |
| | Labour | H. Carr | 3,662 | 70% | |
| | Labour | Mrs. E. E. Gough | 3,634 | 69% | |
| | Labour | W. G. Ingham | 3,403 | 65% | |
| | Conservative | R. S. Fairclough | 1,598 | 30% | |
| | Conservative | J. E. Kendrick | 1,326 | 25% | |
| | Conservative | K. John | 1,301 | 25% | |
| Majority | 2,064 | | |
| Registered electors | 11,931 | | |
| Turnout | 5,260 | 44% | |
| | Labour gain from Conservative | Swing | | |
St. Mary's
St. Mary's - 3 seats | Party | Candidate | Votes | % | ±% |
| | Labour | E. C. Pimlett | 3,115 | 51% | |
| | Labour | S. R. Maddox | 3,059 | 50% | |
| | Labour | W. J. Thompson | 3,004 | 49% | |
| | Conservative | J. Richard's | 2,709 | 44% | |
| | Conservative | H. Clarke | 2,684 | 44% | |
| | Conservative | H. B. Fairclough | 2,492 | 40% | |
| Majority | 406 | | |
| Registered electors | 12,241 | | |
| Turnout | 6,165 | 50% | |
St. Michael's
St. Michael's - 3 seats | Party | Candidate | Votes | % | ±% |
| | Conservative | A. B. Collins * | 3,759 | 72% | |
| | Conservative | G. W. Pickles * | 3,756 | 72% | −4% |
| | Conservative | F. Bidston * | 3,650 | 70% | −5% |
| | Labour | F. Chadwick | 1,464 | 28% | −8% |
| | Labour | K. Chowley | 1,393 | 27% | −9% |
| | Labour | Mrs. E. E. Wright | 1,379 | 26% | −10% |
| Majority | 2,295 | | |
| Registered electors | 10,847 | | |
| Turnout | 5,223 | 48% | −4% |
| | Labour hold | Swing | | |
| | Labour hold | Swing | | |
| | Labour hold | Swing | | |
Comparisons with former Sefton Park West ward.
Smithdown
Smithdown - 3 seats | Party | Candidate | Votes | % | ±% |
| | Labour | L. Holden * | 3,372 | 64% | −1% |
| | Labour | J. Johnstone * | 3,332 | 64% | −3% |
| | Labour | W. Gibbs | 3,194 | 61% | −6% |
| | Conservative | F. W. Holland | 1,860 | 36% | +3% |
| | Conservative | B. S. Morgan | 1,836 | 35% | +2% |
| | Conservative | T. Hillock | 1,835 | 35% | +2% |
| Majority | 1,512 | | |
| Registered electors | 13,735 | | |
| Turnout | 5,232 | 38% | −2% |
| | Labour hold | Swing | | |
| | Labour hold | Swing | | |
| | Labour hold | Swing | | |
Comparisons with former Edge Hill ward.
Speke
Speke - 3 seats | Party | Candidate | Votes | % | ±% |
| | Labour | A. Hardman * | 3,543 | 63% | |
| | Labour | B. Crookes * | 3,436 | 61% | −5% |
| | Labour | W. H. Sefton | 3,201 | 57% | −9% |
| | Conservative | G. Edwards (PARTY) | 2,088 | 37% | |
| | Conservative | L. J. Murphy | 1,936 | 34% | |
| | Conservative | E. Norton | 1,872 | 33% | |
| Majority | 1,455 | | |
| Registered electors | 12,164 | | |
| Turnout | 5,631 | 46% | −5% |
| | Labour hold | Swing | | |
| | Labour gain from Conservative | Swing | | |
| | Labour hold | Swing | | |
Comparisons made with the former Garston ward.
Tuebrook
Tuebrook - 3 seats | Party | Candidate | Votes | % | ±% |
| | Conservative | J. F. Bradley | 3,707 | 51% | |
| | Conservative | J. E. Molyneux | 3,698 | 51% | |
| | Conservative | E. F. Pine | 3,660 | 50% | |
| | Labour | W. I. Davies | 3,547 | 49% | |
| | Labour | V. Burke | 3,539 | 49% | |
| | Labour | R. W. Counsell | 3,516 | 48% | |
| Majority | 160 | | |
| Registered electors | 14,359 | | |
| Turnout | 7,254 | 51% | |
Vauxhall
Vauxhall - 3 seats | Party | Candidate | Votes | % | ±% |
| | Labour | E. Corrigan | 2,523 | 71% | |
| | Labour | D. Cowley | 2,492 | 70% | |
| | Labour | John Sheehan | 2,410 | 68% | |
| | Democratic Labour | T. Hogan * | 1,013 | 29% | |
| | Democratic Labour | J. O'Neill | 872 | 25% | |
| | Communist | R. Cuerdon | 301 | 9% | |
| Majority | 2,523 | | |
| Registered electors | 11,956 | | |
| Turnout | 3,536 | 30% | |
| | Labour hold | Swing | | |
Warbreck
Warbreck - 3 seats | Party | Candidate | Votes | % | ±% |
| | Conservative | F. Woolfenden | 4,609 | 62% | |
| | Conservative | A. W. Lowe | 4,571 | 62% | |
| | Conservative | D. F. Brady | 4,484 | 61% | |
| | Labour | J. Murphy | 2,781 | 38% | |
| | Labour | A. Hardisty | 2,752 | 37% | |
| | Labour | C. A. Keech | 2,692 | 36% | |
| Majority | 1,828 | | |
| Registered electors | 14,418 | | |
| Turnout | 7,390 | 51% | |
| | Labour gain from Conservative | Swing | | |
Westminster
Westminster - 3 seats | Party | Candidate | Votes | % | ±% |
| | Labour | J. Hamilton | 2,300 | 53% | |
| | Labour | F. Murphy | 2,296 | 53% | |
| | Labour | R. J. Alcock | 2,219 | 52% | |
| | Conservative | E. Shaw | 2,006 | 47% | |
| | Conservative | S. E. Goldsmith | 1,867 | 43% | |
| | Conservative | A. G. Cleather | 1,865 | 43% | |
| Majority | 294 | | |
| Registered electors | 8,739 | | |
| Turnout | 4,306 | 49% | |
| | Labour gain from Conservative | Swing | | |
Woolton
Woolton - 3 seats | Party | Candidate | Votes | % | ±% |
| | Conservative | G. F. Caitlin | 4,161 | 68% | |
| | Conservative | J. Norton | 4,128 | 67% | |
| | Conservative | J. B. Smart | 4,096 | 67% | |
| | Labour | Mrs. R. M. Checkett | 1,963 | 32% | |
| | Labour | T. Churchill | 1,958 | 32% | |
| | Labour | I. Cocker | 1,904 | 31% | |
| Majority | 2,198 | | |
| Registered electors | 11,679 | | |
| Turnout | 6,124 | 52% | |
[2] [3]
By-elections
Abercromby, Wednesday 30 September 1953
Cllr. Thomas George Dominic Maguire (Abercromby, Labour) died on 24 August 1953 [4]
Abercromby | Party | Candidate | Votes | % | ±% |
| | Labour | Kenneth Walter Counsell | 2,493 | | |
| | Conservative | Reginald John McLaughlin | 1,852 | | |
| Majority | | | |
| Registered electors | 12,845 | | |
| Turnout | | | |
| | Labour hold | Swing | | |
Vauxhall, Thursday 19 November 1953
Two vacancies in the Vauxhall ward were created by the death of Alderman Bertie Victor Kirby C.B.E. D.C.M. on 1 September 1953,[5] Cllr. John Sheehan was elected as Alderman by the City Council on 7 October 1953 and assigned as Returning Officer for the Granby ward.[6] and the resignation of Cllr. Edward Corrigan.[7]
Vauxhall - 2 seats | Party | Candidate | Votes | % | ±% |
| | Labour | Anthony Dunford | 2,018 | | |
| | Labour | Joseph Cyril Brady | 2,049 | | |
| | Communist | Richard Cuerdon | 140 | | |
| Majority | | | |
| Registered electors | 11,956 | | |
| Turnout | | | |
| | Labour hold | Swing | | |
| | Labour hold | Swing | | |
[8]
Allerton, Thursday 17 December 1953
A vacancy in the Allerton ward was created by the death of Cllr. Margaret Jane Strong (Conservative, Allerton) on 11 November 1953.[9]
Allerton - 3 seats | Party | Candidate | Votes | % | ±% |
| | Conservative | Stephen Minion | 1,594 | | |
| | Labour | Vincent Burke | 282 | | |
| Majority | | | |
| Registered electors | 9,742 | | |
| Turnout | | | |
| | Conservative hold | Swing | | |
[10]
References
- ^ Jeffery, David. "Merseyside Local Election Results Project". Dr David Jeffery. Retrieved 14 April 2021.
- ^ Liverpool Daily Post 8 May 1953
- ^ Liverpool City Council Proceedings of the Council 1953-1954
- ^ Proceedings of the Council 1953-54 page 290
- ^ Proceedings of the Council 1953-54 page 291
- ^ Proceedings of the Council 1953-54 page 305
- ^ Proceedings of the Council 1953-54 page 489
- ^ Proceedings of the Council 1953-54 page 489
- ^ Proceedings of the Council 1953-54 page 488
- ^ Proceedings of the Council 1953-54 page 563


 Local elections in Merseyside


